
Look at this chart from Interim Director of Municipal Financial Operations Robert Cortinas’ presentation last Tuesday:
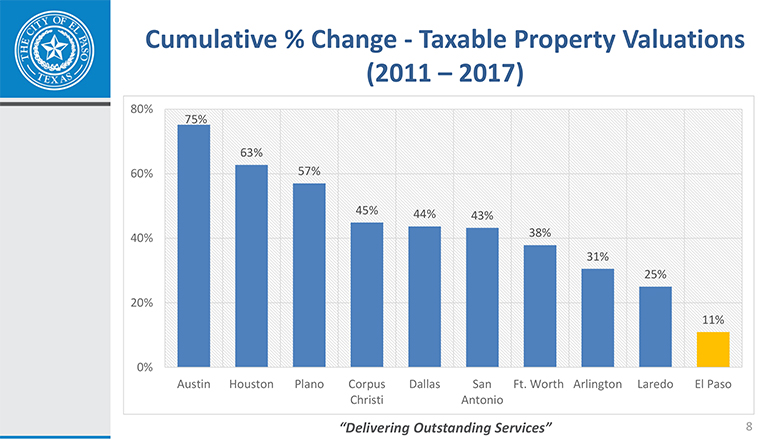
It shows the growth of taxable property values for the biggest cities in Texas since 2011.
Now look at this chart from the U.S. Census Bureau, detailing the change in population estimates for the City of El Paso:

(The estimates for 2017 won’t be out till, I think, June.)
But notice that between 2011 and 2012, the estimated population grew by 10,289. That’s more than double its growth any year since 2012.
I’m thinking that the values of taxable property grew a relative lot between 2011 and 2012, and the only reason Mr. Cortinas started his series in 2011 was because something else happened in 2012, something that our purported “leaders” didn’t want us to recognize.
2012 was the year that City Council decided that El Paso needed a Triple A ballpark. 2012 was the year that the Quality of Life bonds passed. 2012 was the year that our population growth flatlined. And I’m betting that 2012 was the year that our taxable property values started dwindling.
Maybe that’s just an amazing, unrelated, coincidence.
But maybe not.